Introduction: The Shift from Satellite to Drone-Based Exploration

The use of multispectral drone imagery has completely revolutionized advanced mineral exploration and alteration mapping.For decades, resource geologists have relied on multispectral satellite imagery—such as Landsat 8, ASTER, and Sentinel-2—to identify regional hydrothermal alteration footprints. These satellite platforms are invaluable for grassroots exploration, allowing geologists to detect iron oxides, clay minerals, and silica-rich zones across vast terrains. However, traditional satellite imagery suffers from a significant limitation: spatial resolution. With pixel sizes ranging from 10 to 30 meters, satellite data is often too coarse for prospect-scale mapping, drill collar targeting, or detailed structural analysis.
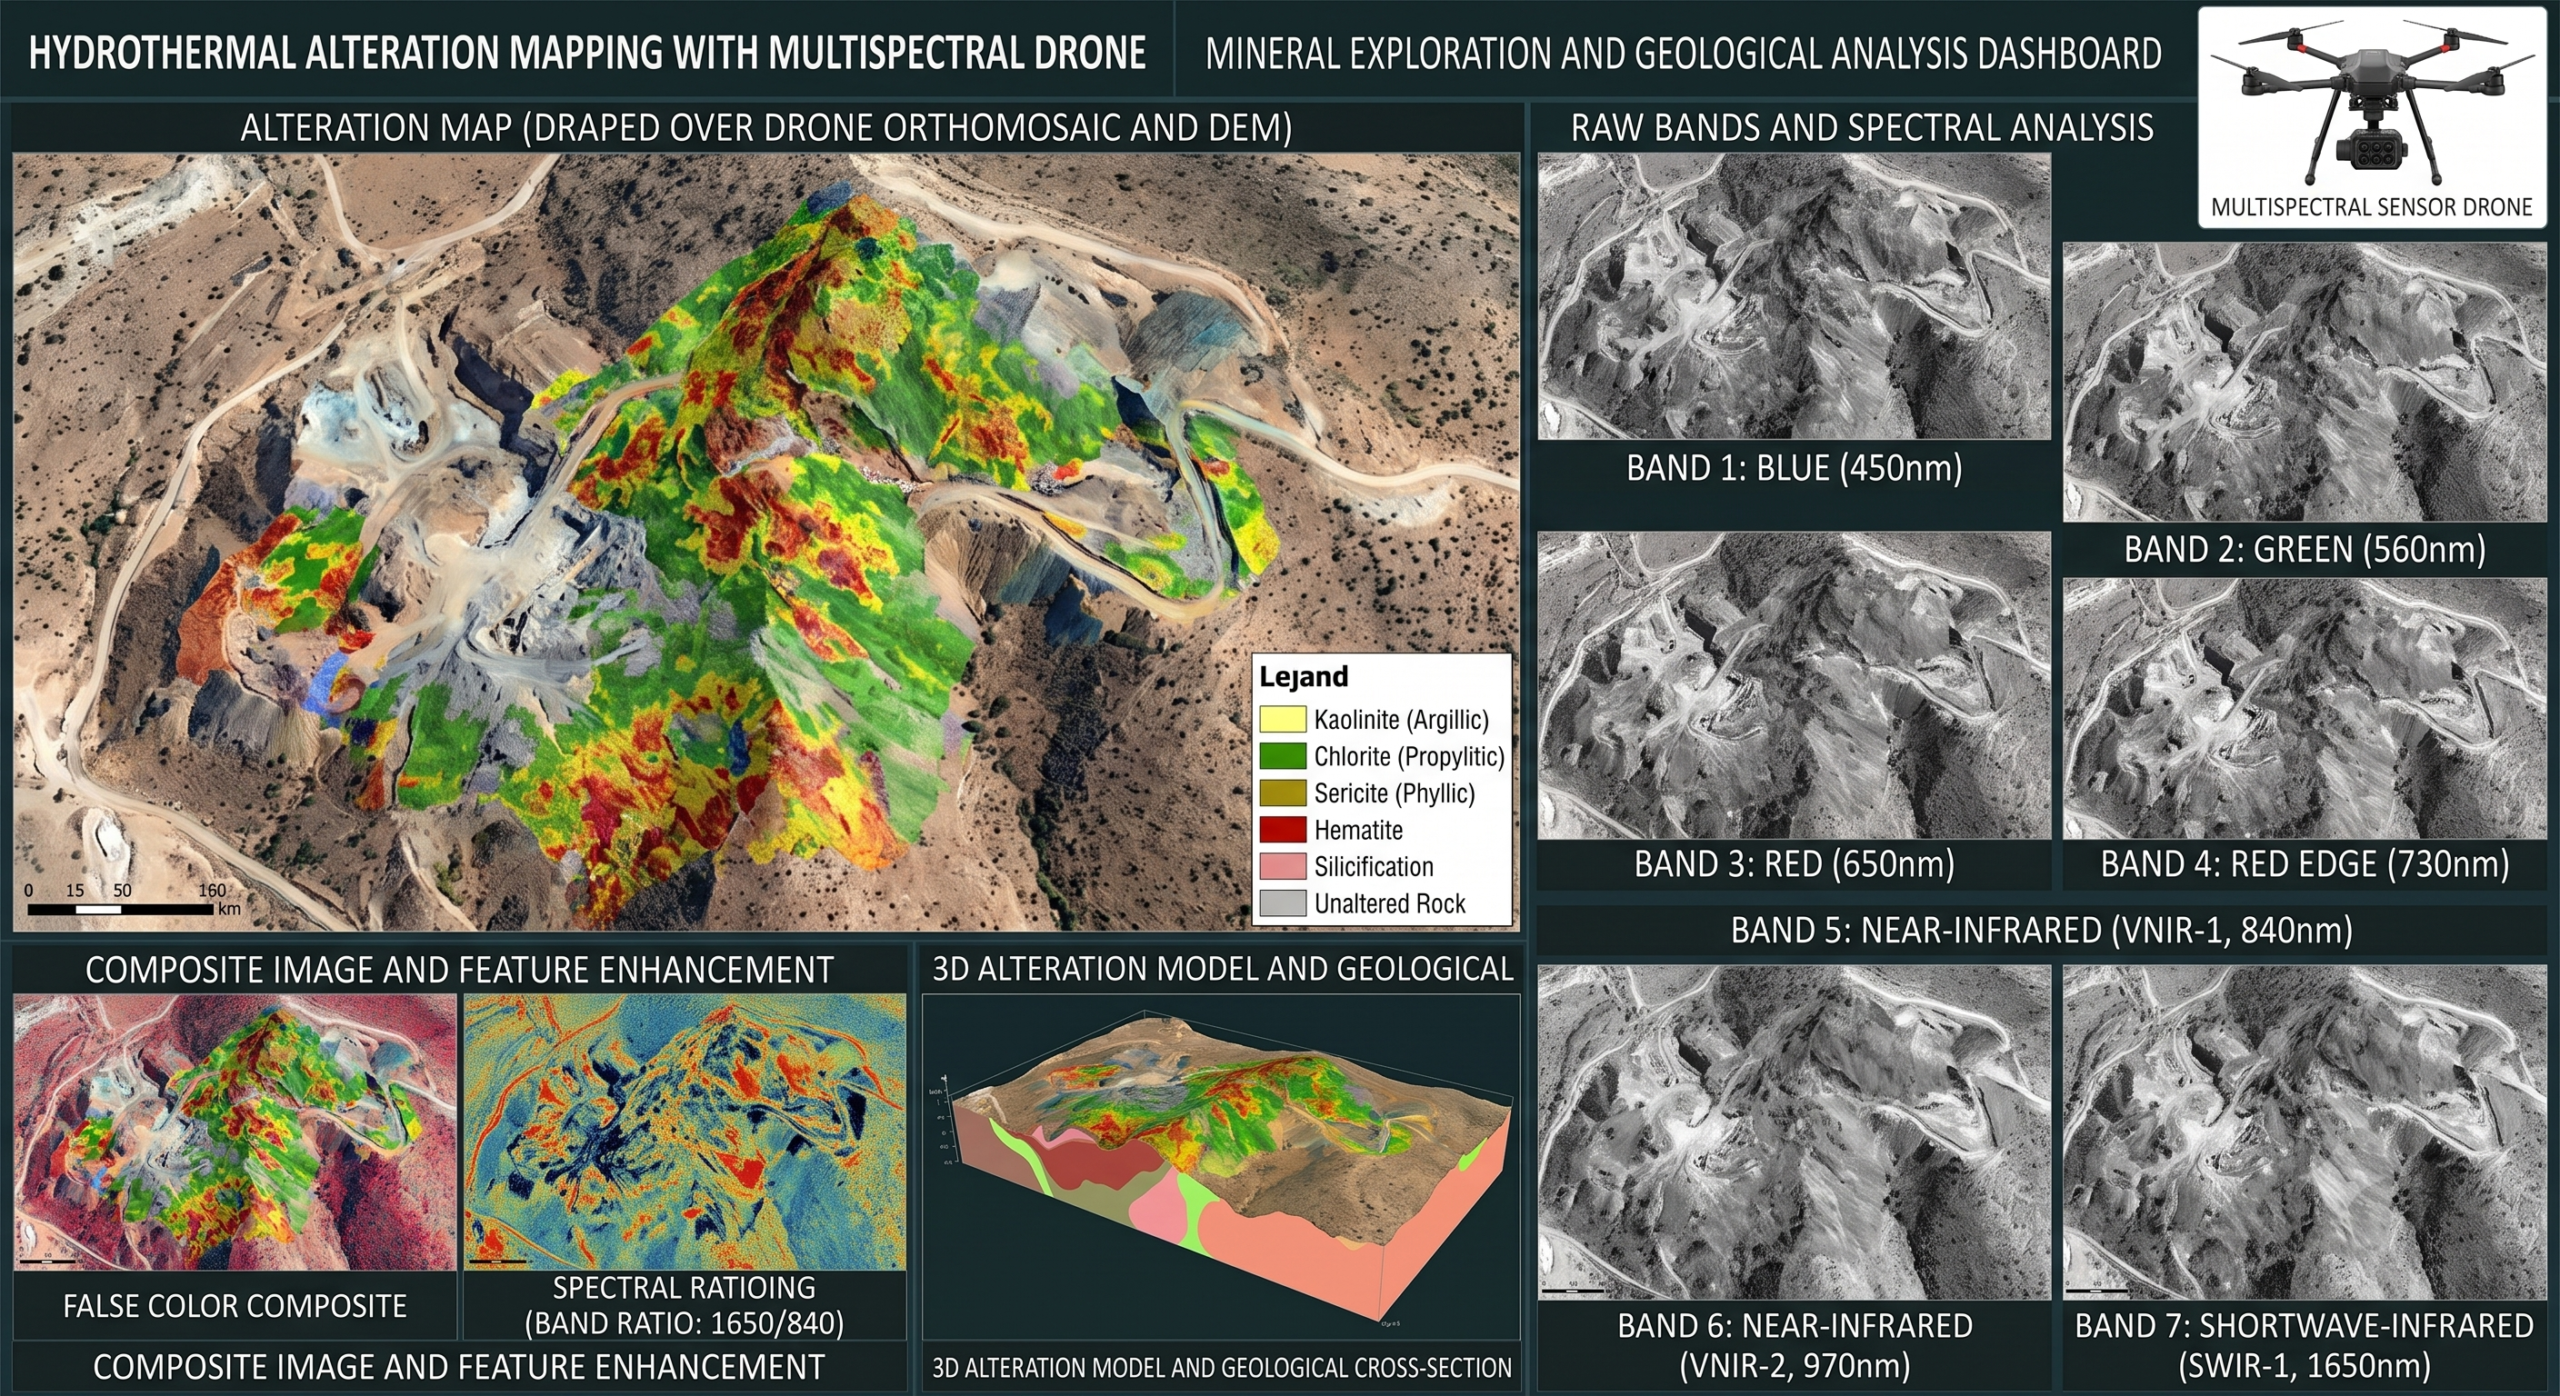
The integration of Unmanned Aerial Vehicles (UAVs) equipped with multispectral and hyperspectral sensors has completely revolutionized this workflow. Drones bridge the critical gap between regional satellite data and ground-based field mapping. By capturing spectral data at centimeter-level resolution, geologists can now delineate narrow alteration halos around specific vein systems, map intricate structural controls, and generate high-resolution alteration zone maps that directly inform drilling programs. This comprehensive guide outlines the complete step-by-step workflow for utilizing multispectral drone imagery to create accurate alteration zone maps.
Understanding Spectral Signatures in Hydrothermal Alteration
Before deploying a drone, it is essential to understand the physics of light and how specific mineral assemblages interact with the electromagnetic spectrum. Hydrothermal fluids moving through host rocks cause chemical and mineralogical changes, creating alteration zones (e.g., argillic, phyllic, propylitic, and silicic). These altered rocks reflect and absorb sunlight differently than the surrounding unaltered country rock.
- Iron Oxides (Gossans and Leached Caps): Minerals like hematite, goethite, and jarosite exhibit strong absorption features in the Blue to Green wavelengths due to electronic transition processes, but they reflect strongly in the Red and Near-Infrared (NIR) regions.
- Hydroxyl-Bearing Minerals (Clays): Minerals characteristic of argillic and phyllic alteration, such as illite, kaolinite, and montmorillonite, have highly specific absorption features in the Shortwave Infrared (SWIR) region (typically around 2.1 to 2.2 micrometers) due to Al-OH bond vibrations.
By utilizing sensors that capture these specific wavelengths—mimicking the band configurations of ASTER or Landsat—we can isolate these mineral signatures and map their spatial distribution across a project area.
Step 1: Drone Hardware and Sensor Selection
The success of an alteration mapping campaign depends entirely on the payload. A standard RGB camera is insufficient for identifying complex mineralogy; you need sensors capable of capturing discrete bands of light.
- Multispectral Sensors: Systems like the MicaSense RedEdge or DJI Multispectral capture data across 5 to 10 discrete bands, usually covering the Visible to Near-Infrared (VNIR) spectrum (Blue, Green, Red, Red Edge, NIR). These are highly effective for mapping iron oxides, vegetation anomalies (geobotany), and gossanous outcrops.
- Hyperspectral Sensors: For advanced clay mapping (argillic and phyllic zones), a SWIR hyperspectral sensor is required. These sensors capture hundreds of narrow, contiguous spectral bands, allowing for the precise identification of individual clay minerals based on their unique absorption troughs.
- UAV Platform: The drone must be equipped with an RTK (Real-Time Kinematic) module. Sub-centimeter positional accuracy is non-negotiable when these raster datasets will eventually be integrated with drillhole collars and 3D subsurface models.Selecting the right sensor is the most critical part of capturing accurate multispectral drone imagery.
Step 2: Flight Planning and Terrain-Aware Acquisition

Capturing high-quality spectral data requires meticulous flight planning. Unlike standard topographic mapping, spectral data is highly sensitive to lighting conditions and shadows.
- Solar Angle: Flights must be conducted as close to solar noon as possible (typically between 11:00 AM and 2:00 PM). This minimizes topographical shadowing, which can severely distort spectral reflectance values and lead to false anomalies in steep terrain.
- Overlap and Sidelap: To ensure a flawless photogrammetric reconstruction of the orthomosaic, set the front overlap to at least 80% and side overlap to 75-80%.
- Terrain Awareness: In rugged mountainous regions, the drone must utilize a digital elevation model (DEM) to maintain a constant altitude above the ground. If the drone’s altitude fluctuates relative to the terrain, the Ground Sample Distance (GSD) will vary, corrupting the spatial resolution of the final raster.
Step 3: Radiometric Calibration and Pre-Processing
This is the most critical technical step in the workflow. The raw images captured by the drone record radiance (the amount of light reaching the sensor). However, to compare this data to known mineral spectra, it must be converted to reflectance (the intrinsic property of the rock surface, independent of sunlight intensity).
Before the drone takes off, the operator must capture images of a calibrated reflectance panel (a target with known reflectance values across all wavelengths). A Downwelling Light Sensor (DLS) mounted on top of the drone also continuously records variations in sunlight (e.g., passing clouds) during the flight.
During the pre-processing stage in photogrammetry software (such as Agisoft Metashape or Pix4D), these calibration images and DLS data are used to perform radiometric correction. The software then stitches the hundreds of individual multispectral images into a single, highly accurate, radiometrically calibrated multispectral orthomosaic.This radiometric correction ensures that your multispectral drone imagery is ready for precise geological analysis.
Step 4: Band Ratios and Raster Math in QGIS and MapInfo

Once the calibrated multispectral orthomosaic is generated, it must be processed using robust GIS environments to extract geological meaning. Both QGIS and MapInfo are exceptionally powerful platforms for executing the raster mathematics required for alteration mapping.
The most common technique for highlighting mineral zones is the Band Ratio method. By dividing the digital number of one band by another, we can suppress topographic shading effects and enhance the spectral differences between specific minerals.
Using the Raster Calculator in QGIS, you can replicate traditional satellite ratios at a micro-scale:
- Iron Oxide Ratio (Red / Blue): Because iron oxides reflect red light and absorb blue light, dividing the Red band by the Blue band will result in a raster where high pixel values (bright white) represent strong iron oxide concentrations.
- Ferrous Minerals (NIR / Red): This ratio highlights rocks rich in ferrous iron.
- Clay Alteration / SWIR Ratios: If a SWIR sensor was deployed, a ratio of SWIR 1 / SWIR 2 (mimicking ASTER bands 4/6) will isolate argillic alteration zones.
In QGIS, the formula in the Raster Calculator looks simple (e.g., "Band_Red@1" / "Band_Blue@1"). Once calculated, you apply a pseudo-color render to the resulting raster layer, turning the highest numerical values into bright red or magenta zones, instantly visualizing the alteration halo on your map.Machine learning algorithms work exceptionally well with high-resolution multispectral drone imagery.
Step 5: Unsupervised and Supervised Classification
While band ratios provide excellent visual indicators, generating a discrete polygon map of alteration zones requires image classification.
- Unsupervised Classification (K-Means): The GIS software groups pixels with similar spectral signatures into a specified number of clusters. The geologist then evaluates these clusters and assigns geological meaning to them based on field knowledge.
- Supervised Classification (Random Forest / Maximum Likelihood): The geologist provides “training data” by drawing small polygons over known, field-verified alteration outcrops (e.g., a known patch of kaolinite or a confirmed hematite vein). The machine learning algorithm within the GIS software then analyzes the spectral signature of these training sites and classifies the rest of the drone mosaic accordingly.Machine learning algorithms work exceptionally well with high-resolution multispectral drone imagery.
Step 6: 3D Integration and Structural Modeling
A 2D alteration map is highly valuable, but its true potential is unlocked when integrated into a 3D environment.
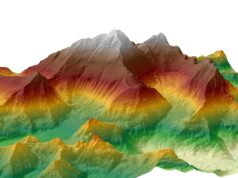
The finalized alteration raster and its corresponding high-resolution Digital Surface Model (DSM) can be directly imported into advanced geological modeling software like Leapfrog Geo or Datamine. By draping the multispectral alteration map over the 3D topography, resource geologists can correlate surface alteration footprints directly with subsurface structural models, block models, and existing drillhole intercepts.
For instance, visualizing a strong argillic alteration anomaly at the surface directly above a modeled, blind structural fault provides exceptional confidence for planning the next phase of diamond drilling.
Conclusion: Elevating Mineral Exploration Workflows
Transitioning from traditional satellite imagery to high-resolution multispectral drone mapping represents a paradigm shift in mineral exploration. By carefully selecting the right sensors, applying rigorous radiometric calibration, and utilizing advanced raster math, geologists can generate highly precise alteration zone maps. The future of structural mapping and targeting relies heavily on the quality of multispectral drone imagery.This workflow not only reduces the time spent on manual field mapping in hazardous terrain but also provides unparalleled accuracy in drill targeting, ultimately reducing exploration risk and increasing the probability of resource discovery.